
The pie chart was invented in 1801 by William Playfair. They’ve been in constant use since then but since computers made them easy to create, they’re even more popular.
Pie charts are popular but they don’t work for all types of data. Let’s look at when you should make a pie chart to break down your data.
What is a Pie Chart?
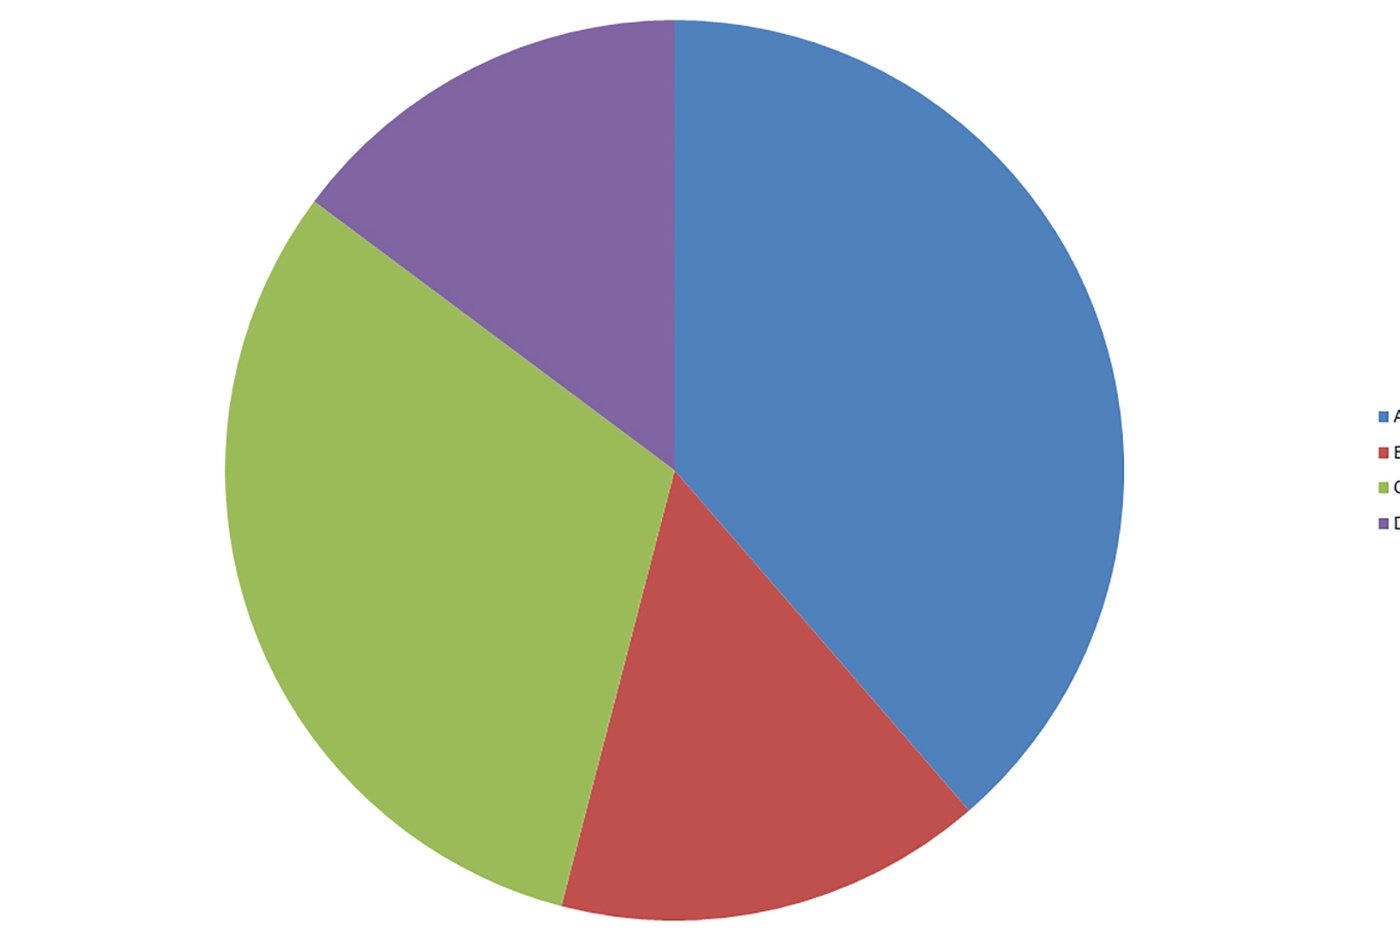
A pie chart is a circular chart that’s broken into segments, or wedges, like a pie that’s been cut into pieces. Each segment represents part of the total, making it easy to see the relative size of each piece.
Pie charts may be designed to look like a three-dimensional chart and may use an “exploded” design with one or more segments separated from the rest for emphasis.
What’s Unique About Pie Charts
Pie charts don’t have an obvious axis like most other chart types. The axis is actually the perimeter of the circle but it’s not marked with any type of legend the way line or bar charts would be.
Pie charts are only effective for a single set of data. If you have two or more sets, they can’t be overlaid without making the chart too hard to read. Either create separate pie charts for each set or use another type of chart that will display multiple data sets more effectively.
Pie charts also don’t work for negative values. There’s no way to draw a “negative” segment in the chart.
What Type of Data Pie Charts Work Best For
Pie charts are ideal for seeing the composition of a set of data. Anything that can get broken down into percentages or proportional amounts work well, such as:
When using a pie chart creator, avoid zero values and try to stay away from very small values. A zero value won’t be visible as a segment in the chart and very small value will be difficult to see as well.
Tips to Make a Pie Chart
When you create a pie chart, it’s best to keep the number of segments to six or fewer. If you have more than six segments, the chart will get overcrowded and it will be hard to see the differences between the size of each segment.
It’s also not a good idea to have segments that are too close to the same size. Too many similar-sized segments make it hard to see any difference there might be. A bar or line chart makes it easier to identify small variations between the values on the chart.
When designing pie charts, the color or shading scheme also affects how easy it is to visualize the different values. Try to shade or color the chart from dark to light as you move around the circle. And if you’re designing the chart with color, use complementary colors for the best effect.
If you’re not sure what colors work well together, use a color wheel to find combos that match up well.
Put Some Thought into Your Charts
Modern software makes it easy to throw together a quick chart but if you need to make a pie chart, put a little time and thought into it. Your readers will appreciate it and the information you’re explaining will come across more effectively.
Did you find this post helpful? Take a look around the rest of our blog for more interesting articles like this one.
After a year in limbo, the Patriots are expected to climb their way back to…
MEMPHIS -- Derrick White called the 2022 NBA Finals his lowest moment. A 5-for-8 start from three…
The Boston Celtics closed out a perfect six-game road trip — the first sweep of…
The Boston Red Sox have their ace of the present and future locked up. Ace…
On this episode of the Greg Bedard Patriots Podcast, Greg reacts to Mike Vrabel's comments…
On the latest episode of the All 32 NFL Podcast, Mike Giardi and Will Parkinson…


